
Profit Factor: The One Number Every Signal Services Hide From You
Win rate tells you how often you win. Profit factor tells you whether winning actually makes money. Here is how to calculate it and why scammers never show it.
If you have spent any time in crypto trading Telegram groups, you have seen some version of this pitch: "87% win rate, verified results, join our VIP for $99/month." The number sounds impressive. It is also nearly meaningless on its own.
Profit factor is the metric that exposes why.
What Profit Factor Actually Is
Profit factor (PF) is the ratio of gross winning dollars to gross losing dollars across a set of trades.
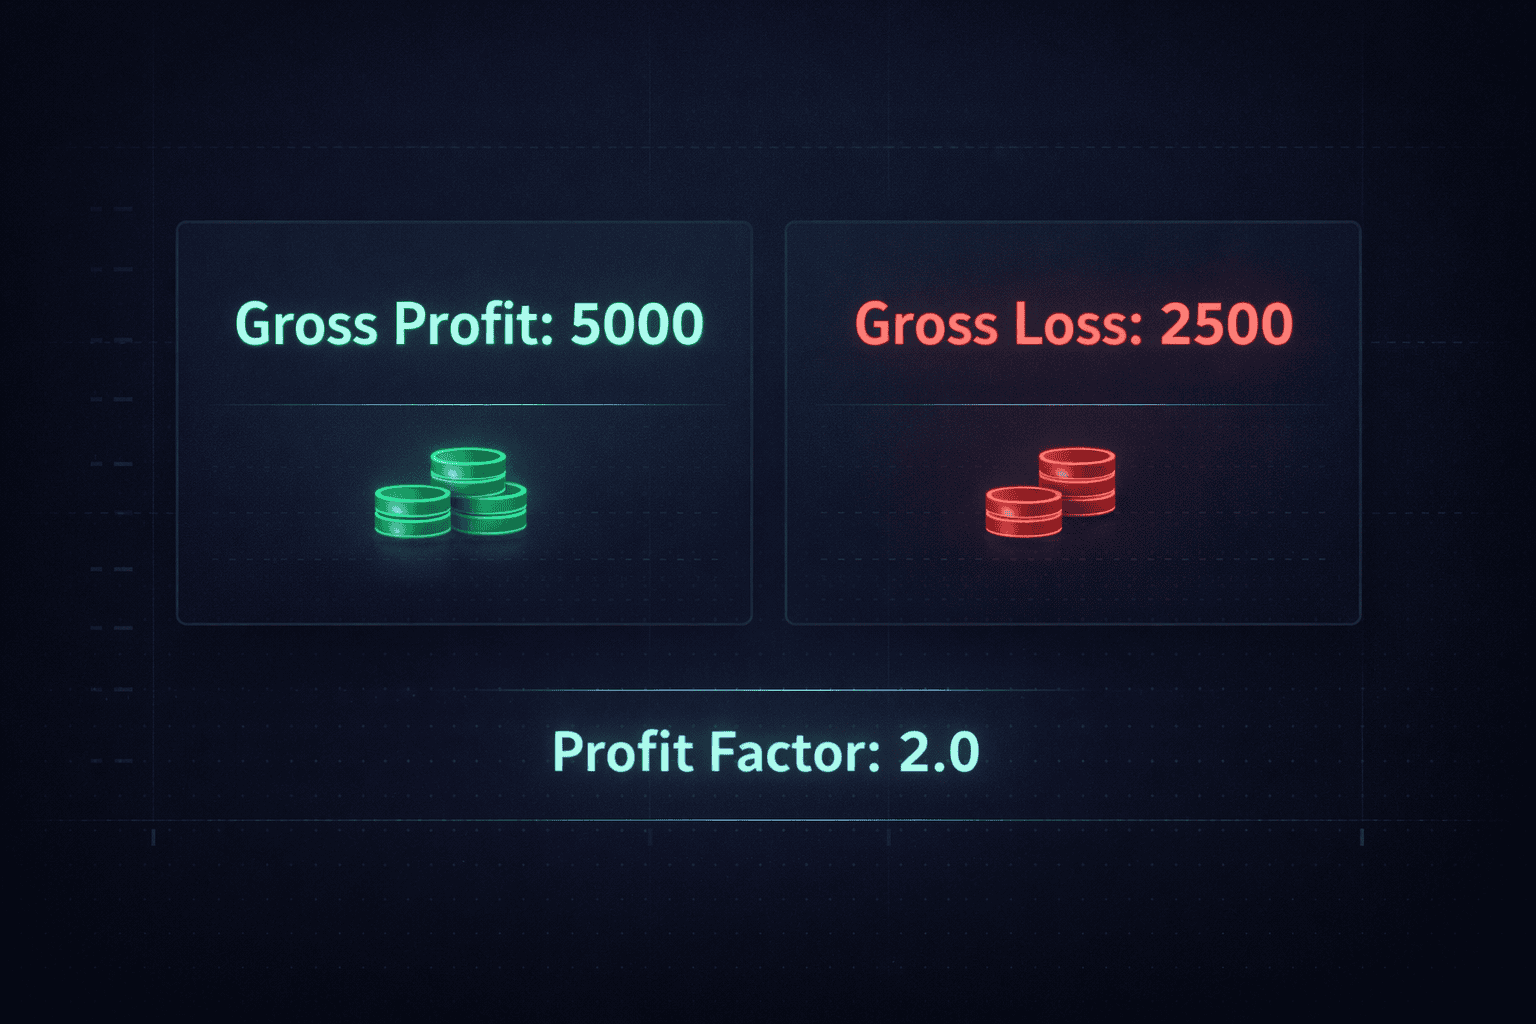
Profit Factor = Total Gross Profit / Total Gross LossThat is it. No trick math. If a system made $10,000 in winners and lost $6,000 in losers over the same period, its profit factor is:
PF = $10,000 / $6,000 = 1.67A profit factor above 1.0 means the system made money. Below 1.0, it lost money. Exactly 1.0 means break-even before fees.
As a rough benchmark:
- PF below 1.0: The system loses money.
- PF 1.0–1.25: Barely profitable, fragile to fees and slippage.
- PF 1.25–1.75: Decent. Worth serious evaluation with a large enough sample.
- PF 1.75–2.5: Strong, if the sample is statistically significant.
- PF above 2.5: Either genuinely excellent or you are looking at a cherry-picked backtest with too few trades.
Those brackets are not gospel. They are heuristics. What matters more is understanding why profit factor is more informative than win rate alone.
Why Win Rate Alone Is a Trap
Imagine two signal services, both running 100 trades.
Service A — the Telegram VIP special:
Service B — boring and uninstagrammable:
Service A has an 85% win rate and a profit factor of 0.76. It is bleeding money. Service B wins fewer than half its trades and has a profit factor of 1.82. It is printing.
The BingX screenshot crowd will always show you Service A numbers, because 85% wins looks credible to someone who doesn't sit down and do the math. Profit factor makes the deception visible in under thirty seconds.
The Relationship Between Profit Factor, Win Rate, and Risk-Reward
These three numbers are not independent. Given any two, you can derive the third. The connecting formula is:
PF = (Win Rate × Average Winner) / (Loss Rate × Average Loser)

where Loss Rate = 1 − Win Rate
Or equivalently, using risk-reward ratio (RRR = average winner / average loser):
PF = (Win Rate × RRR) / (1 − Win Rate)This formula has a useful consequence: any win rate can be profitable with the right risk-reward ratio, and any win rate can be a losing system with the wrong one.
A 30% win rate needs a minimum RRR of about 2.33 just to break even (PF = 1.0). A 70% win rate only needs a RRR of about 0.43 to break even — meaning you can afford to let losers be bigger than winners, but only up to a point.
When a signal service shows you win rate without showing you average winner and average loser, they are hiding at least one of those two numbers. There is no innocent reason for that omission.
Profit Factor vs. Expectancy: What Is the Difference?
Profit factor tells you the ratio of winning to losing dollars. Expectancy tells you the expected dollar return per unit risked per trade.
Expectancy = (Win Rate × Average Winner) − (Loss Rate × Average Loser)Using the same Service B numbers from earlier:
Expectancy = (0.45 × 4%) − (0.55 × 1.8%)
           = 1.80% − 0.99%
           = +0.81% per trade
Both metrics matter, but they answer different questions:
- Profit factor measures system quality as a ratio. It is scale-invariant and useful for comparing systems regardless of position size.
- Expectancy measures the average value of one trade in absolute terms. It depends on how you define "one unit risked," but it tells you directly whether playing the system has positive expected value.
A system can have a high profit factor on small edge and a mediocre expectancy if trade frequency is low. A high-frequency scalping system might run a PF of 1.3 but generate strong absolute returns just by turning over a lot of trades. Neither metric alone is the full picture — you want both.
Why Sample Size Is the Catch Nobody Talks About
Here is a question most traders never ask: how many trades do you need before a profit factor number means anything?
More than you think.
With 20 trades, random noise can produce a profit factor anywhere from 0.5 to 3.0 even on a genuinely break-even system. The variance is enormous. This is exactly why Telegram groups post a "last 20 calls" screenshot rather than a full year of results: it is trivially easy to cherry-pick a 20-trade run that looks stellar.
A rough minimum for statistical credibility:
- 50 trades: You can start forming weak opinions.
- 100 trades: The profit factor estimate is meaningful enough to act on, with caution.
- 200+ trades across multiple market conditions: Now you have something.
Even at 100 trades, a confidence interval around a measured PF of 1.5 is wide enough that the true value could sit anywhere from about 1.1 to 2.0. That is not a reason to ignore profit factor — it is a reason to demand large samples and to be suspicious of any service that only shows you a short window.
The honest way to handle this is to report the number and the sample size together, always. A profit factor of 1.9 over 30 trades is noise. A profit factor of 1.6 over 300 trades across a trending quarter and a ranging quarter is a signal.
How Scammy Services Manipulate Profit Factor (Without Lying)
Once you know what profit factor is, you can reverse-engineer the manipulations:
1. Micro-TP, macro-SL. Set take-profits at 0.5% and stop-losses at 5%. Close winners fast, let losers run hoping for a reversal. Win rate skyrockets. Profit factor collapses. This is the most common Telegram playbook.
2. Manual close cherry-picking. Never publish a fixed SL. Close losing trades "manually" when convenient. Assign the loss to "market conditions." The published record omits those closes or logs them as a smaller loss than reality.
3. Hindsight signals. Post entry and exit after the candle closes. The chart never shows the signal as it happened in real time. Verifiable only if entries are time-stamped before the move.
4. Small sample windows. Show only the last two weeks. A 14-day hot streak can look like a PF of 4.0. Zoom out and it reverts.
5. Excluding fees and funding rates. Crypto perpetual futures charge funding every 8 hours. On leveraged positions, that eats into wins and amplifies losses. A PF of 1.2 before fees can be sub-1.0 after.
The defense against all five is identical: demand a full, time-stamped, independently verifiable record with a large sample, consistent SL/TP rules, and fees included. If the service can't provide that, the number they're showing you is a prop, not a result.
What a Trustworthy Profit Factor Report Looks Like
A signal service that actually wants you to evaluate it honestly should show you:
- Total trade count over the period, not just "recent calls."
- Entry and exit timestamps logged before the outcome was known.
- Gross profit and gross loss separately, so you can verify the ratio yourself.
- Average winner and average loser in consistent units (percent of account at risk, not arbitrary dollar amounts).
- Maximum drawdown during the period, because a PF of 1.8 with a 40% max drawdown is a different instrument than a PF of 1.8 with a 12% max drawdown.
- Market regime breakdown if possible — does the edge hold in trending markets, ranging markets, or both?
Cryptographic verification takes this further. If each signal is hashed and published on-chain or in a verifiable ledger before the trade closes, there is no room to add, remove, or alter entries retroactively. That is a higher standard than any screenshot can meet.
Profit Factor in the Context of a Full System Evaluation
Profit factor is essential, but it sits inside a broader diagnostic framework. When you are evaluating any trading system or signal service, run through at least these four numbers:
Profit Factor (PF): Quality of edge. Should be 1.25+ on a meaningful sample.
Expectancy: Expected return per trade per unit risked. Should be positive after fees.
Maximum Drawdown (MDD): Worst peak-to-trough equity decline. Tells you the psychological and capital cost of following the system.
MAR Ratio (Compound Annual Growth Rate / Maximum Drawdown): A quick composite of return and pain. A MAR above 1.0 is a rough bar for "worth considering."
Optionally, Sharpe ratio (return per unit of volatility, annualized) if you want to compare across asset classes or strategies with very different volatility profiles.
None of these metrics alone is sufficient. A system with PF 2.0 but a 70% max drawdown will blow most traders' accounts through emotional decision-making before the edge pays out. A system with a razor-thin PF of 1.15 is one bad month from being indistinguishable from noise.
The combination tells the story.
A Worked Example Using Real Numbers
Suppose a service publishes the following on its track record page (a real one, not a screenshot):
- Trades: 210 closed
- Gross profit: 487R (where 1R = 1 unit of risk per trade)
- Gross loss: 263R
- Win rate: 52%
- Average winner: 4.46R
- Average loser: 2.60R
- Max drawdown: 11.4R
- Period: 14 months
Let's verify:
PF = 487 / 263 = 1.85

Expectancy = (0.52 × 4.46) − (0.48 × 2.60)
           = 2.319 − 1.248
           = +1.07R per trade

RRR = 4.46 / 2.60 = 1.72
Now ask: does the PF formula check out from RRR and win rate?
PF = (0.52 × 1.72) / (0.48) = 0.894 / 0.48 = 1.86 ✓ (rounding)The numbers are internally consistent. That is not proof the service is good — it just means they haven't made an arithmetic error or an obvious fabrication. You'd still want to check timestamps, fee assumptions, and whether a 14-month period includes at least one bear and one bull regime.
But this is what honest reporting looks like. You can verify the math yourself in 90 seconds.
The Bottom Line
Win rate is a marketing number. Profit factor is an audit number.
Any service serious about transparency publishes both — along with average winner, average loser, sample size, drawdown, and verifiable timestamps. Anything less is asking you to trust a number you cannot check.
If a signal service's pitch leads with win rate and buries or omits profit factor, treat that as a red flag, not a selling point. The math is not complicated. The reason they don't show it usually is.
Ezath publishes its full track record, including profit factor, expectancy, and trade-by-trade data secured by a SHA-256 hash chain, so no result can be added or altered after the fact. If you want to see what a transparent record looks like in practice, check the public track record — no sign-up required.
— The Ezath team